Analytics breakdowns
Delivery speed and rate, carrier and country performance, and SKU velocity — with the filters that drive them.
AdminOperator
Updated 2026-06-04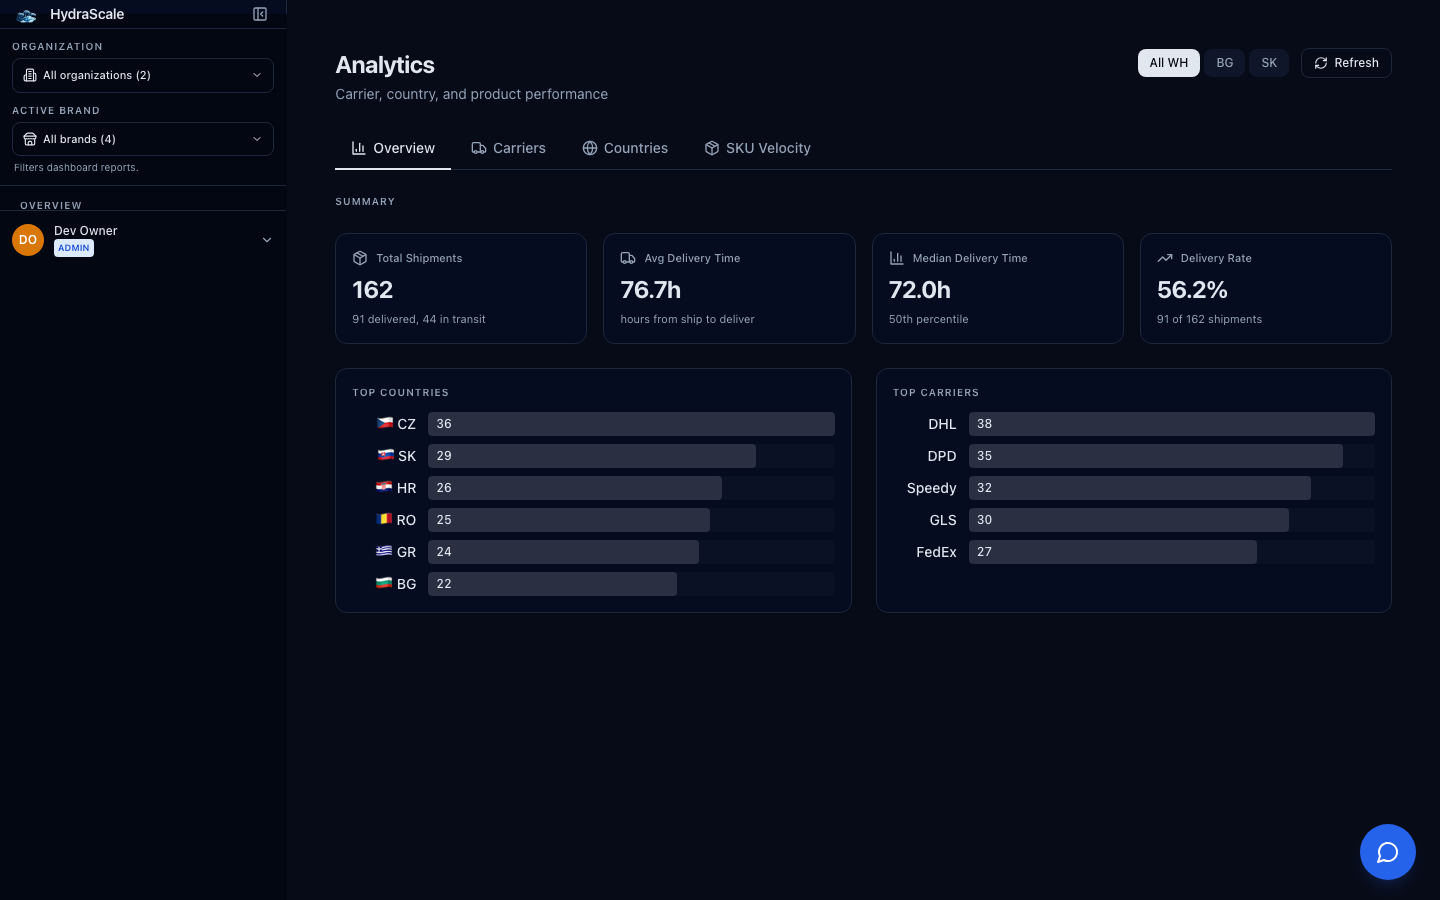
The operational deep-dive
Analytics goes past the money to how the business actually runs: how fast parcels arrive, which carriers and countries perform, and how quickly each SKU sells. Use it to spot a slow lane or a stalling product before it shows up in refunds or stockouts.
Views
- Summary / Overview
- Headline totals — Total Orders, Total Shipments, Total Units Sold, Active SKUs — for the selected span.
- Carriers
- Carrier Performance: Top Carriers by volume with Delivery Rate and Avg / Median Delivery Time (hours from ship to deliver).
- Countries
- Country Performance: Top Countries with the same delivery-rate and delivery-time lens per destination market.
- SKU Velocity / SKU Detail
- Daily Velocity by SKU and a Velocity Summary — units sold per day, to tell movers from dead stock.
Filters
- Date Span
- Sets the window for every metric. Delivery-time medians need a span wide enough to capture completed deliveries.
- Warehouse (All WH / BG / SK)
- Scope the analysis to one fulfilment warehouse to compare lanes.
- Delivery-time percentile (e.g. 50th / median)
- Read typical delivery time rather than an average skewed by a few stuck parcels.